

Clustering is a data analysis technique whose goal is to partition a dataset into groups of similar samples. In machine learning terms, we would call clustering algorithms unsupervised, since these techniques are applied to unlabeled data points. Typical applications of clustering algorithms are customer segmentation, pattern recognition, outlier detection and many others.
Representative-based clustering is a category of algorithms whose underlying idea is that each cluster is characterized by an archetypal point. Finding those representatives means finding the clusters by grouping those points with similar ones.
K-Means algorithm, the topic of this post, embodies this concept by looking for the centroid of each cluster.
In mathematical terms, the goal of K-Means is to find the clustering that minimizes the sum of squared errors (SSE), which is defined as the sum of the distances between each point and the centroid of its clusters for all clusters.

In other words, a good clustering, hence one characterized by a low SSE, identifies as clusters groups of points that are very similar to their centroid.
Let's go more in-depth. Here is K-Means pseudocode:
Initialize k centroids according to some criterion.
Assign each point to the cluster represented by the closest centroid.
Update each centroid by computing the average of the points belonging to its cluster.
Repeat 2-3 until the difference between the new centroids and the old ones is smaller than a threshold or we reached a maximum amount of iterations.
We'll implement this algorithm in Python by loosely following the scikit-learn API.
Let's start by importing some of the libraries we'll need.
import numpy as np
import matplotlib.pyplot as plt
Then, we generate a dataset that we'll use to test our algorithm.
from sklearn.datasets import make_blobs

seed = 24 #seed for reproducibility
X, _ = make_blobs(centers=3, n_samples=1500, random_state=seed)
Let's visualize the dataset with a scatterplot.
plt.scatter(X[:,0], X[:,1])

We can easily see that the dataset can be partitioned into 3 clusters. We'll see if our algorithm can come up with this solution on its own.
Next, we'll create a class called KMeans. It has three methods:
the
constructor, which we'll use to define the parameters of the algorithm.fit(), that implements the algorithm.predict(), which returns the clustering identified by the algorithms.
class KMeans:
    def __init__(self, n_clusters=5,init = "random",
                            n_iter = 100,tol = 1e-4):

        self.n_clusters = n_clusters
        self.n_iter = n_iter #number of iterations the algorithm will run
        self.tol = tol #centroid updates threshold
        self.init = init #centroids initialization method

    def fit(self,X):
        pass

    def predict(self,X):
        pass
K-means requires us to define the number of clusters that we aim to identify before running the algorithm. This is one of its major drawbacks, since knowing the right number of clusters a priori is almost impossible in real-life scenarios, where data is multidimensional and thus not visualizable. There are strategies to deal with this issue, but we'll not cover them in this tutorial.
The other parameters that can be specified when creating an object are: the maximum number of iterations, the centroid initialization method, the centroid update threshold and the maximum number of iterations.
Let's implement the fit() method. The first thing we need to do is initialize the centroids according to the method specified when creating the object.
Let's start by initializing randomly our centroids, choosing K random points from the dataset. As it doesn't take advantage of the distribution of the data, it is certainly not the greatest solution we can come up with. A more effective method will be examined later in this tutorial.
def fit(self,X):
     if self.init == "random":
            centroids_indexes = np.random.randint(X.shape[0], size =
                                    self.n_clusters)
            self.centroids_ = X[centroids_indexes,:]
    else:
        raise ValueError("Invalid initialization method")
We generate an array of length n_clusters containing random integers, whose maximum value is the number of rows of the dataset. Then, we use these numbers as indices to select the initial centroids.
The next step is to initialize the array that will contain the clustering labels. We use the efficient numpy function empty(), specifying that the array will have the same number of rows of the dataset, which is obvious since we'll assign a label to each data point.
self.labels_ = np.empty(X.shape[0])
We then proceed to implement the iterative part of the algorithm.
 for _ in range(self.n_iter):

    for i in range(X.shape[0]):
        point = X[i,:]
        distances_to_centroids = [np.linalg.norm(point - centroid)
                            for centroid in self.centroids_]
        closest = np.argmin(distances_to_centroids)
        self.labels_[i] = closest

    new_centroids = []

    for cluster in range(self.n_clusters):
        cluster_points = X[self.labels_ == cluster]
        new_centroids.append(np.mean(cluster_points, axis = 0))

    np_new_centroids = np.array(new_centroids)
    if self.tol > np.linalg.norm(np_new_centroids - self.centroids_):
       break
    else:
       self.centroids_ = np_new_centroids
The algorithm runs a maximum number of times specified at the creation of the object unless the breaking condition is hit.
Each iteration starts by iterating over all the points of the dataset. For each point, we compute the distance with all the centroids. We then assign that point to the cluster of the closest centroid. There's no explicit connection between centroids and values of labels, we just assume that the first element of the array self.centroids_ relates to cluster 0 and so on.
Once all points have been assigned to a cluster, we update the centroids based on the clusters just identified (step 3 of the pseudocode). For each cluster, we select the points belonging to that cluster and we compute the new centroid as the mean value along all columns (setting axis = 0 serves this purpose).
The last step consists in checking if the new centroids are effectively different from the ones we previously had. We assess this by computing the difference between the old and new centroids and then comparing the norm of the resulting vector with the user-specified threshold. We keep iterating only if the norm is greater than the threshold, meaning that we still have room for improving our centroids estimates.
The fit() method ends by returning a reference to the object itself, as scikit-learn suggests.
def fit(self,X):
    ...
    return self
We keep predict() method very simple. The only thing it does is return the labels computed after fitting the dataset. We don't handle the case in which predict is called without fitting the dataset, which would result in an error since self.labels_ wouldn't be defined. This is slightly different from the way in which prediction is handled in scikit-learn, whose predict method also require the dataset as parameter but outputs the prediction only if the dataset was previously fitted.
def predict(self):
    return self.labels_
It's now time to test our algorithm using the dataset we created before. First, we normalize the dataset using StandardScaler. This is crucial since we want all features to account equally in norm computations.
from sklearn.preprocessing import StandardScaler

X = StandardScaler().fit_transform(X)
Let's set the seed for reproducibility and run the algorithm.
np.random.seed(seed)

kmeans = KMeans(n_clusters = 3)
cluster_prediction = kmeans.fit(X).predict()
centroids = kmeans.centroids_
Let's plot the results.
plt.scatter(X[:,0], X[:,1], c=cluster_prediction)
plt.scatter(centroids[:,0], centroids[:,1], c="r")
plt.show()
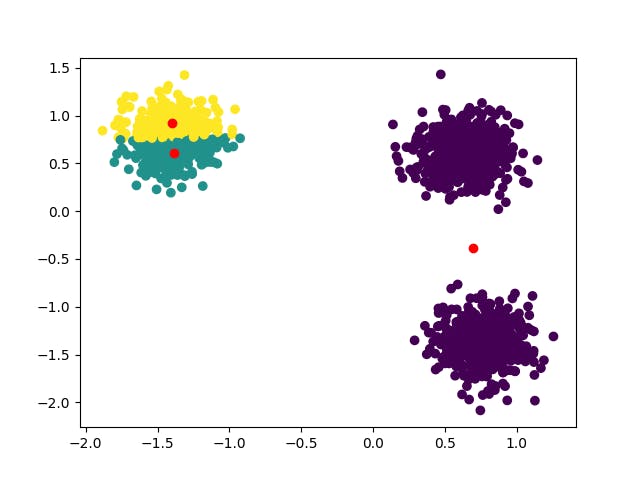
That's quite not the result we expected. The unwise random initialization led our algorithm in the wrong direction and the clusters identified are wrong.
We could try to run the algorithm multiple times, each one with different a seed, and eventually select the best clustering. We could do that here and we might also get lucky with one of them (try seed=1). However, that's not a viable solution when data is multidimensional and not visualizable, like in almost all real-life applications. Even though multiple runs should always be performed (scikit-learn KMeans default implementation reruns the algorithm 10 times), we must consider a stronger initialization method.
That's when k-means++ comes in handy. The underlying idea is to spread initial centroids as much as possible, following the distribution of the data. The first centroid is chosen randomly, while the others are chosen iteratively sampling from the remaining points with probability equal to the distance to the closest centroid.
In other words, if a point is very close to a centroid it will have a low probability of being picked, while isolated points are more likely to become new centroids.
This is the implementation of the algorithm:
def kmeansplusplus(self, X):
    possible_indexes = list(range(X.shape[0]))
    first_centroid_index = np.random.choice(possible_indexes)
    possible_indexes.remove(first_centroid_index)
    centroids = [X[first_centroid_index,:]]

    for _ in range(self.n_clusters - 1):
        distances = []
        for i in possible_indexes:
            point = X[i,:]
            distances_to_centroids = [np.linalg.norm(point - centroid)
                                                for centroid in centroids]
            distances.append(min(distances_to_centroids))

        distances /= sum(distances)
        next_centroid_index = np.random.choice(possible_indexes, p=distances)
        possible_indexes.remove(next_centroid_index)
        centroids.append(X[next_centroid_index,:])

    return centroids
Let's now modify our fit function in such a way it is able to accept this method as well.
def fit(self,X):
    if self.init == "random":
        centroids_indexes = np.random.randint(X.shape[0], size =
                                        self.n_clusters)
        self.centroids_ = X[centroids_indexes,:]
    elif self.init == "kmeans++":
        self.centroids_ = self.kmeansplusplus(X)
    else:
        raise ValueError("Invalid initialization method")
We are done. We can run again the algorithm with this new initialization method and visualize the results.
kmeans = KMeans(n_clusters = 3,init="kmeans++")
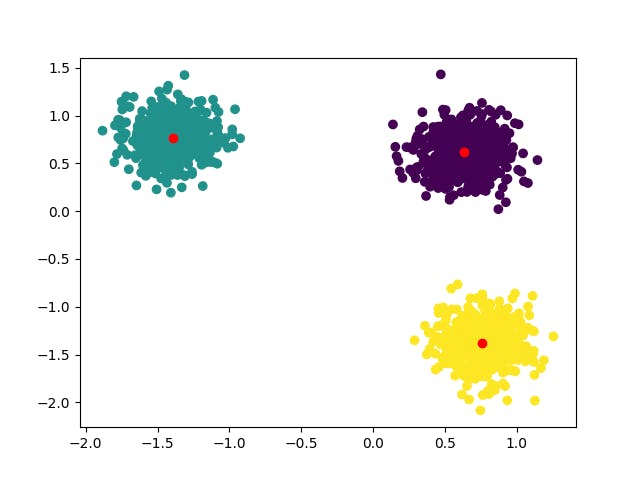
The clustering is now the one we expected.
We knew the clusters were three, but this is not always the case, as previously mentioned. We could try to run the algorithm on the same dataset while specifying a different number of clusters.
fig, axs = plt.subplots(2,2)
axs = axs.flatten()
plt.tight_layout()

for i in range(len(axs)):
        kmeans = KMeans(n_clusters = i+2,init="kmeans++")
        cluster_prediction = kmeans.fit(X).predict()
        centroids = kmeans.centroids_
        axs[i].scatter(X[:,0], X[:,1], c=cluster_prediction)
        axs[i].scatter(centroids[:,0], centroids[:,1], c="r")
        axs[i].set_title(f"K = {i+2}")
This is the result we get.

It's clear that the output of the algorithm is valueless if the the number of clusters is not the right one. This is why we need to validate the results of the clustering both with multiple tries and different clusters numbers in order to get a decent and reliable result.
Finally, a nice animation of KMeans iterative process on a different dataset. The class was modified in order to accept an explicit set of centroids as initializers in order to make the animation possible.

All the code explored in this tutorial is available here: https://github.com/GiovanniGiacometti/Algorithms-From-Scratch/blob/main/KMeans. The code for the animation is an adaptation of this.
Thank you for following!